
To assist European Islands in the decarbonisation of their energy mix, Artelys is developing an Investment Planning Tool (IPT) based on the Artelys Crystal technology, that will enable energy planners, energy system experts and other stakeholders to build, compare and evaluate different scenarios and create cost-effective action plans for their islands.
To facilitate the design of future-proof action plans, the Investment Planning Tool will be able to optimise investments in energy production technologies and flexibility solutions. A rich library of key performance indicators, including energy independence, energy costs, and decarbonisation level, will allow for a quick and robust assessment of the generated scenarios.
The current state of the energy systems of the three “Lighthouse Islands” (Unije, Madeira and Bornholm) have already been modelled within the tool. Thanks to an intuitive web interface, users can explore the model, run simulations and analyse the results. The scope of the simulations includes multi-energy supply-demand equilibrium, and an analysis of power networks.
The tool also includes the possibility to create pathways for the evolution of an insular energy system, thanks to a dedicated library of actions. These actions can represent investments in new power generation technologies, a switch from internal combustion engine cars to electric vehicles, the commissioning of a new power line, etc.
The Investment Planning Tool is currently being finalised, with the integration of tailor-made pathways for the three “Lighthouse Islands”, so as to demonstrate the possibilities offered by the tool to analyse and compare different evolutions of the energy system.
Different demos sessions will be organised during the year to collect feedback from “Lighthouse Islands” and other INSULAE partners, in order to ensure the solution Artelys develops fits the needs of entities in charge of the planning of insular energy systems, in term of modelling capabilities, and possibilities to easily develop new prospective energy scenarios.
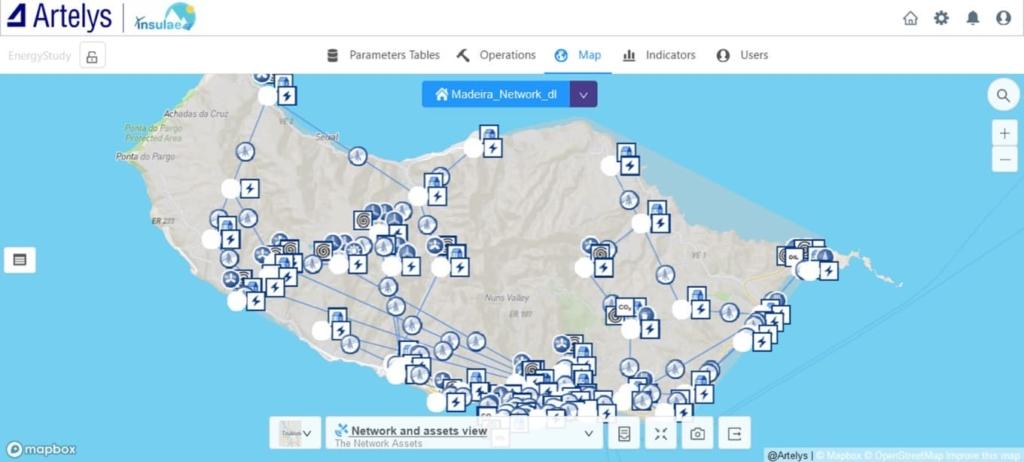
Figure 1 – Representation of the power system model of Madeira in the IPT
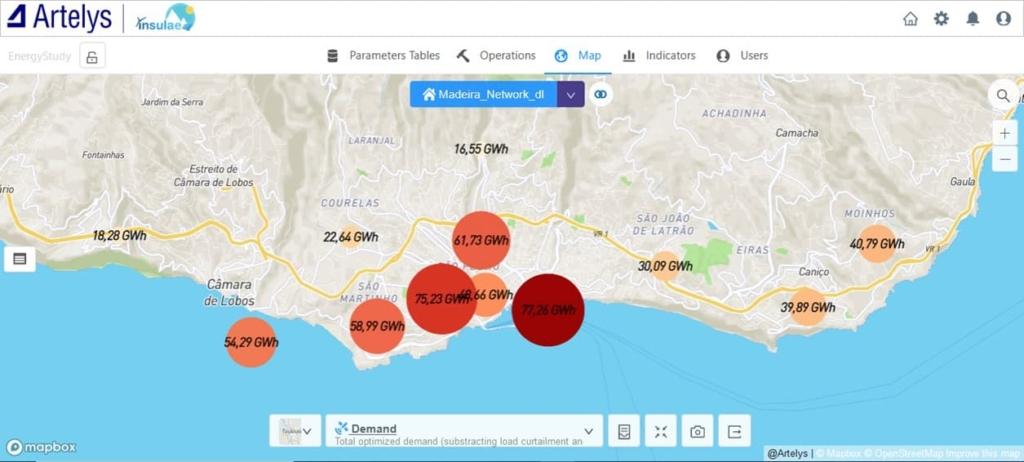
Figure 2 – Annual power demand of different substations in Funchal
Leave A Comment